Serverless computing has profoundly changed the software development approach, shifting the focus away from server management towards creating business logic that adds real value.
AWS Lambda, a core service in AWS’s serverless offerings, is a key player in this transformation.
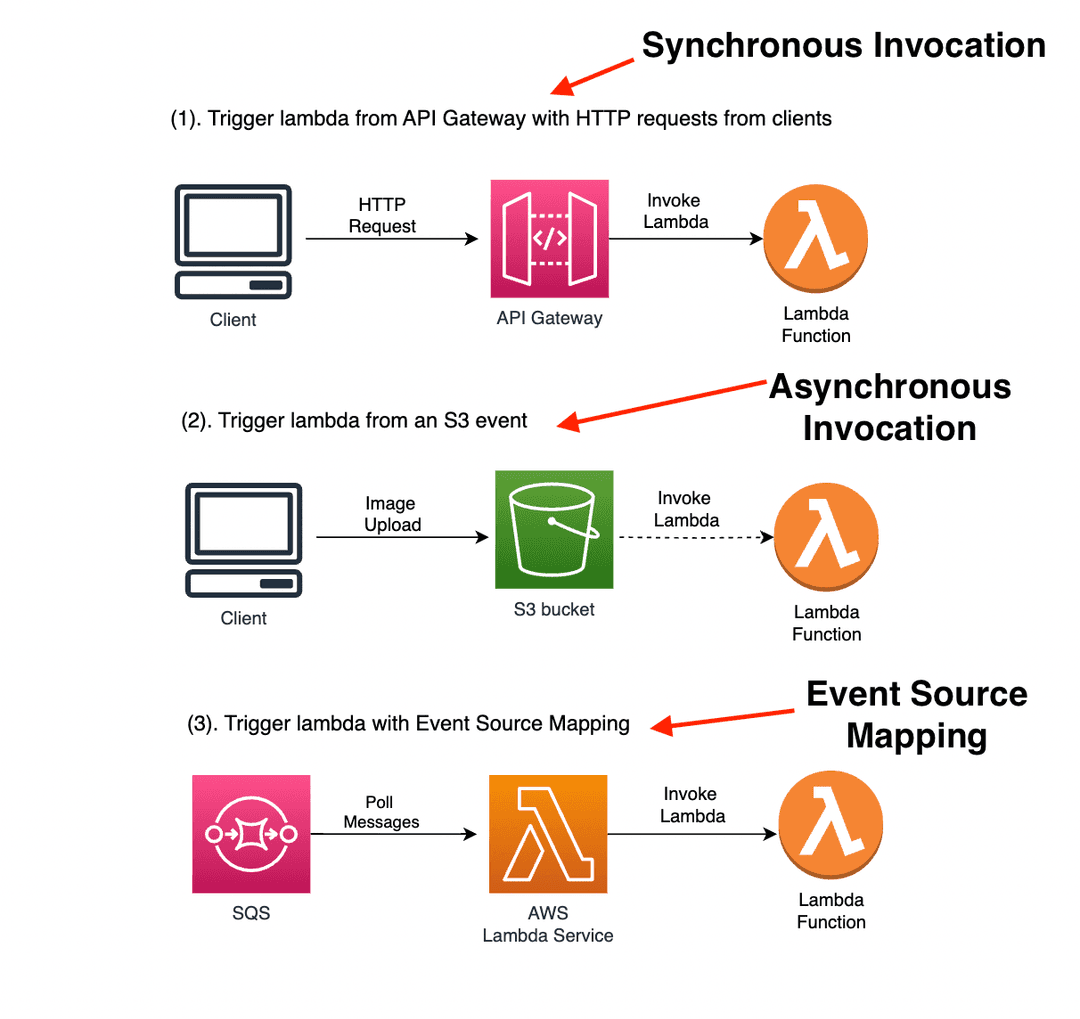
AWS Lambda exemplifies true serverless computing, freeing you from concerns about capacity provisioning and service availability. You simply write code that performs a specific business function, upload it to AWS Lambda, and configure events that trigger this function. These triggers could be anything from an HTTP request (1). Uploading an image to an S3 bucket(2), Adding a message to the Amazon Simple Queue Service(3) (as depicted below).
When a Lambda function is invoked, you pay only for the duration of the execution. Once the execution is complete, the billing stops. This ‘pay-for-usage’ model, along with the ability to automatically scale in response to workload changes, truly encapsulates the essence of serverless computing.
Monitoring is crucial once your Lambda functions are live in a production environment. AWS provides an excellent set of native tools for monitoring like CloudWatch metrics, alarms, and dashboards, yet third-party vendors such as Helios, Datadog, Dashbird, etc… also offer comprehensive tools that easily monitor production workloads and proactively detect errors.
This guide will delve into monitoring Lambda functions, focusing on the three primary types of invocations: synchronous, asynchronous, and Event Source Mapping.
Must-Have Alerts for Monitoring
As mentioned above, there are three primary ways to invoke Lambda functions: Synchronous invocation, Asynchronous invocation, and Event Source Mapping. Let’s briefly explore each of these with examples and discuss the critical alerts we should have in place for each type.
Synchronous Invocation
Synchronous invocation is when you need an immediate response from your Lambda function. One of the best examples is client-facing REST API which uses lambda to process HTTP requests in front of an API Gateway.
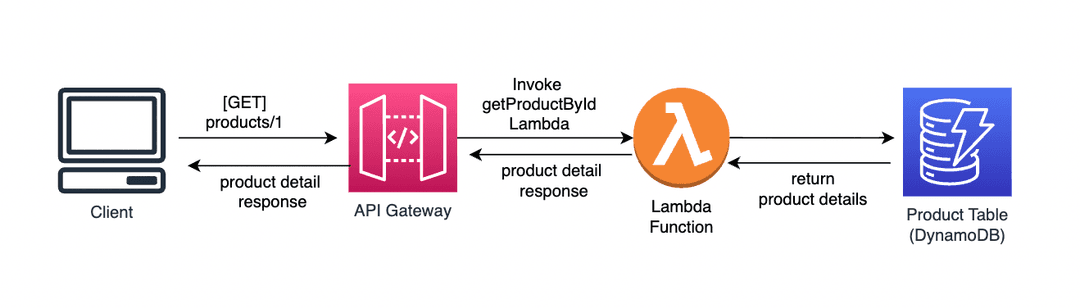
Key alerts for synchronous invocation could include Function Error Rate, Duration, Concurrent Execution and Throttles.
Lambda has a direct integration with Amazon CloudWatch service such that you can find these key metrics in CloudWatch lambda insights.
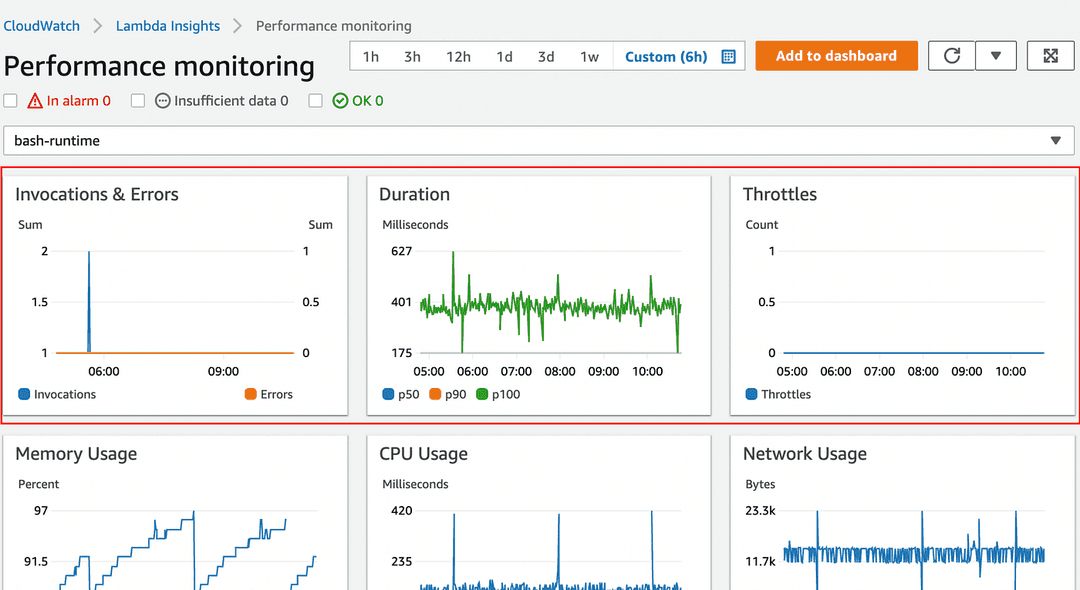
1. Function Error Rate
The function error rate indicates the number of invocations that result in a function error. Function errors can arise from exceptions thrown by your code or by the Lambda runtime. Errors returned by the runtime are often related to issues like timeouts and configuration mistakes. If you want to determine the error rate, you can do so by dividing the number of Errors by the number of Invocations.
Why should you monitor the “Function Error Rate” metric?
Monitoring function error rate is critical because it helps you quickly identify and react to issues in your code or the runtime environment. A sudden increase in function errors can indicate a problem with a new deployment, issues with an external dependency, or even a change in the input data causing unexpected behavior. This can include both exceptions thrown by your code and those thrown by the Lambda runtime itself, such as timeouts and configuration errors.
2. Function Duration
The ‘Duration’ metric, measures the time your function code takes to process an event. The duration that you’re billed for an invocation is based on the ‘Duration’ value, rounded up to the closest millisecond.
P100, P90, and P50 statistical percentiles are often used in performance analysis and monitoring for Lambda functions. For example, P90 is the 90th percentile. If you sort the durations of your Lambda function from least to greatest, the P90 duration is the value below which 90% of the observations fall.
Why should you monitor the “Function Duration” metric?
This metric is important because it directly influences the cost of running your Lambda functions — you are billed for the compute time your functions consume, rounded up to the nearest 1ms. An unexpected increase in function duration could indicate a performance issue, such as a slow external dependency or a change in your code that has made it less efficient. Also, if a function’s duration begins to approach the timeout limit, it could result in the abrupt termination of your function, causing errors and poor user experience.
Did you know? 🤔
When a Lambda function reaches its timeout limit, a message stating “Task timed out” is recorded in the CloudWatch logs for that specific failed invocation. This is different from a regular “Error” message. If you’re searching through your function’s CloudWatch logs and only look for “Error” messages, you will only see errors related to code execution during runtime, not those related to invocation timeouts.
3. Concurrent Execution
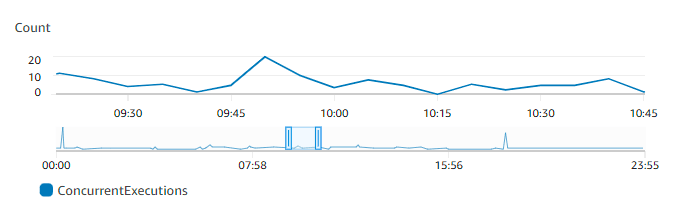
The ‘Concurrency’ of an AWS Lambda function refers to the number of requests that the function is capable of processing simultaneously. This metric is calculated by multiplying the average requests per second by the average duration of the requests in seconds.
For example, if the getProductById Lambda function receives 100 requests per second from API Gateway, and each request takes around 500 milliseconds (or 0.5 seconds) to complete, then the concurrency would be 50 (which is the product of 100 requests and 0.5 seconds).
Why should you monitor the “Concurrent Execution” metric?
Monitoring concurrency is key for understanding the load on your Lambda function. If your function’s concurrency reaches the limit set by AWS, additional invocations will be throttled, potentially leading to increased latency or even failed requests. Also, a sudden change in concurrency could indicate a change in usage patterns or the behaviour of upstream services.
Did you know? 🤔
AWS Lambda doesn’t just have a single concurrency limit. There are two types of concurrency limits to be aware of: Account Concurrency Limit and Burst Concurrency Limit.
The Account Concurrency Limit is the total number of simultaneous function executions that AWS allows for all the lambda functions in a region. The default regional concurrency limit is 1000.
On the other hand, the Burst Concurrency Limit refers to the number of simultaneous executions that AWS Lambda allows in response to a sudden burst of traffic. It varies depending on the region.
4. Throttles
In our discussion about ‘Concurrent Execution’, we noted that AWS Lambda sets a limit on how many function executions can run at the same time within a specific region. To manage this limit more effectively for a particular Lambda function, you can assign a portion of this limit using the ‘Reserved Concurrency’ setting. This ensures that the designated function has a guaranteed number of concurrent executions, and prevents other Lambda functions from taking up this allocated concurrency.
However, if your function reaches its Reserved Concurrency limit, any additional invocations are throttled — that is, they are paused or delayed. Similarly, if the regional limit for unreserved concurrency is reached, other Lambda functions that don’t have Reserved Concurrency could also experience throttling.
This is where the ‘Throttle’ metric comes into play. By monitoring this metric, you can ensure your function’s performance is not hampered due to frequent throttling, which can result in longer execution times and potential timeout errors. Moreover, by keeping track of this metric, you can make necessary adjustments to your function’s concurrency limits or optimize your function for better concurrency handling.
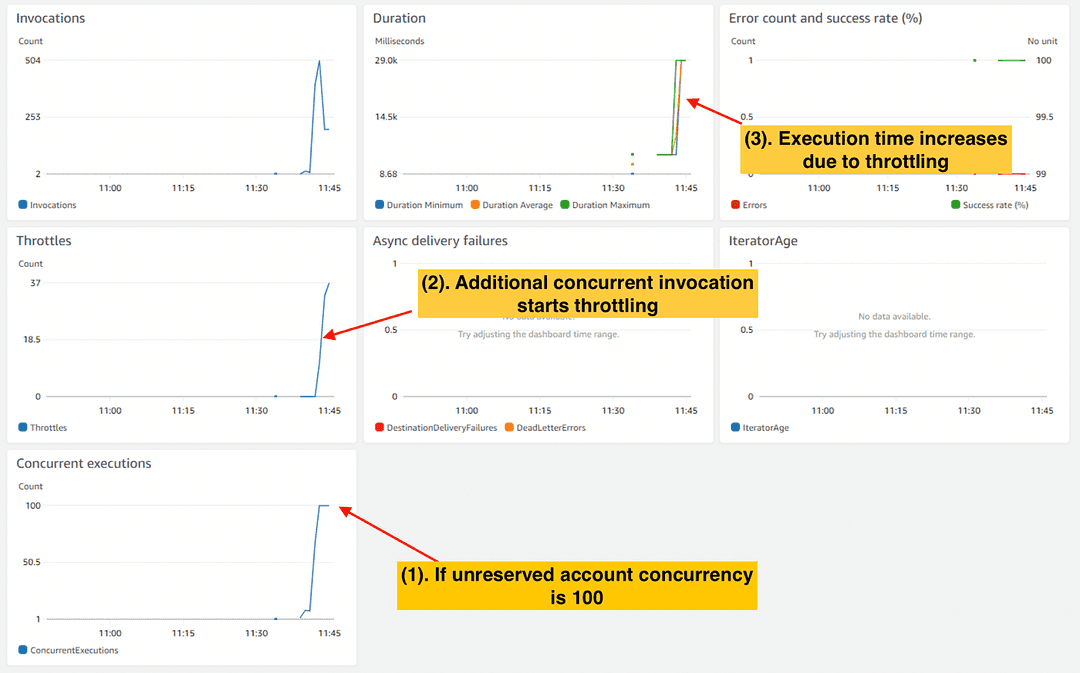
In the above example, the region has an unreserved concurrency limit of 100, observable via the ‘Concurrent Execution’ metric. Consequently, as this limit is reached, additional concurrent executions begin to experience throttling, identifiable through the ‘Throttles’ metric. This throttling, in turn, causes an increase in the function’s execution time, which is detectable by monitoring the ‘Duration’ metric.
By correlating these metrics, we can gain a more holistic insight into the function’s performance and potential bottlenecks, thus enabling timely identification and resolution of issues.
Asynchronous Invocation
When it comes to asynchronous invocation, we can monitor the above metrics i.e. ‘Duration’, ‘Error rate’, ‘Concurrent Execution’, and ‘Throttles’, as these metrics provide valuable insight into the performance and health of your Lambda functions regardless of the invocation type.
In addition to the above metrics, we can also monitor “Dead-Letter Errors” metrics for lambda asynchronous invocation.
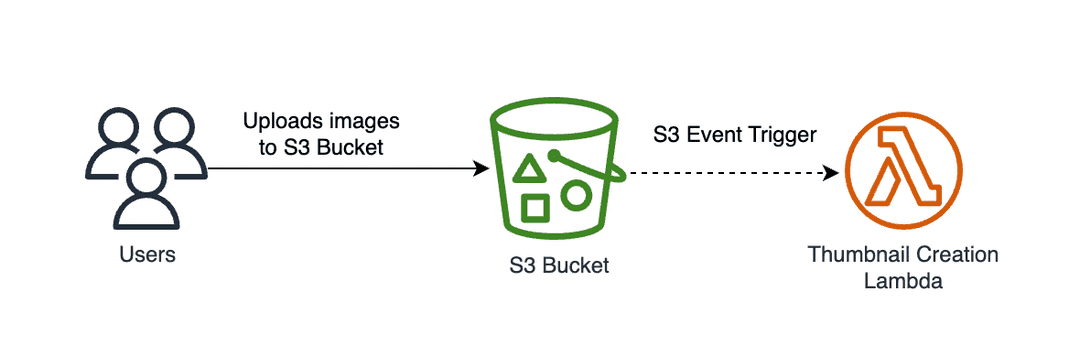
When users upload high-resolution images to an S3 bucket in the above example, an event triggers a Lambda function. This function’s task is to generate thumbnails of the uploaded images and store them in a new/thumbnails folder within the same S3 bucket. The frontend web application subsequently references this folder to display the thumbnail images.
However, if the Thumbnail Creation Lambda encounters an error, the thumbnail won’t be generated. As a result, the frontend application won’t be able to load the thumbnail, negatively affecting the user experience.
To manage this, we can establish a Dead-Letter Queue (DLQ) for the Lambda function. This queue will receive events that encounter errors during processing. By setting up an alarm for the DLQ, developers can be promptly notified when such errors occur, enabling them to take corrective action as quickly as possible.
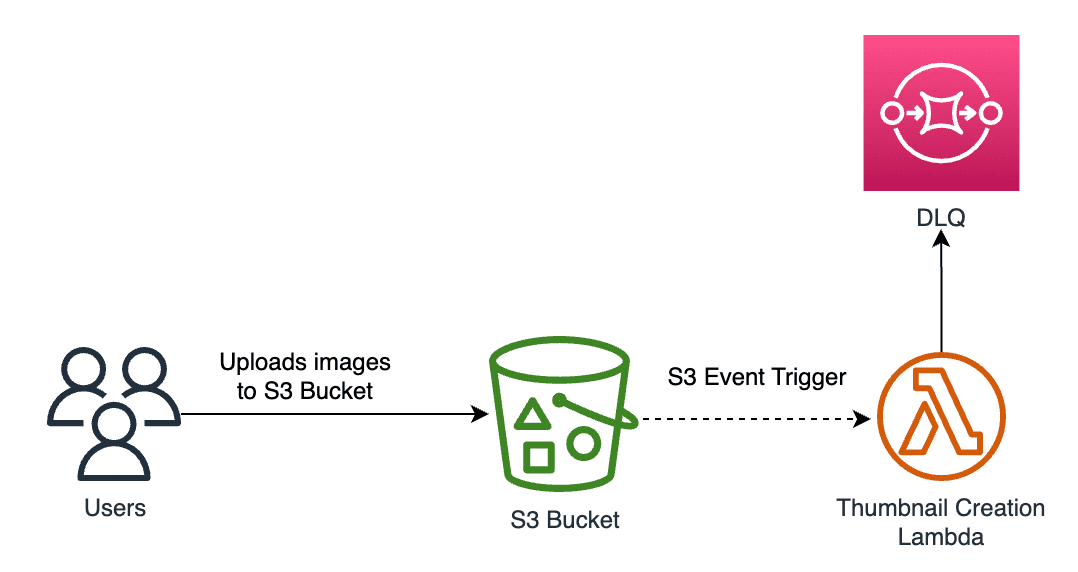
5. Dead-Letter Errors
AWS Lambda allows you to set up a Dead-Letter Queue (DLQ) as a failsafe for asynchronous function invocations.
If a Lambda function fails to process an event, the event can be moved to a DLQ, where it can be examined later. This is particularly useful when dealing with asynchronous invocations, as events that fail are not automatically retried by the calling service.
Why should you monitor the “Dead-Letter Error” metric?
If there’s an issue delivering the failed event to the DLQ, a ‘Dead-Letter Error’ is generated. Monitoring this metric can help you catch data loss related to unprocessed events and prevent potential disruptions in your application’s operations.
Event Source Mapping
In addition to synchronous and asynchronous invocations, AWS Lambda can also be triggered via Event Source Mapping. AWS services like Amazon Kinesis Data Streams, Simple Queue Service (SQS), DynamoDB Stream, Amazon Managed Streaming for Apache Kafka (Amazon MSK) support event source mapping.
Let’s consider Kinesis Data Stream. In this case, Kinesis serves as the event source that triggers the Lambda function. Lambda polls the Kinesis stream and invokes the function synchronously with the data records it retrieves.
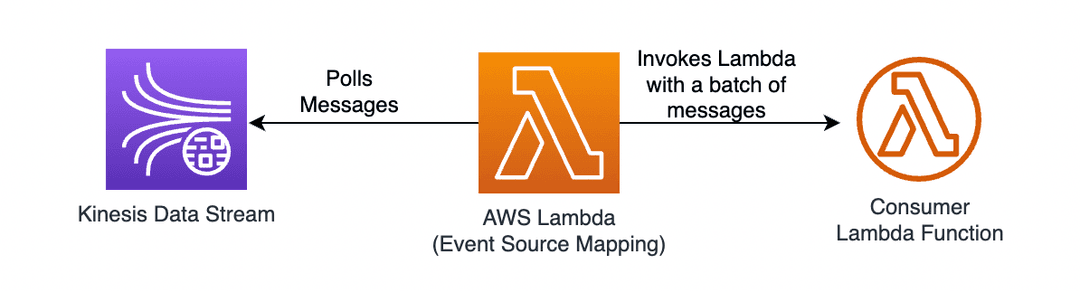
In the example above, the AWS Lambda Event Source Mapping resource polls the Kinesis Data Stream for messages and invoke the consumer lambda function with a batch of records.
6. Iterator Age
When we use Event Source Mapping to invoke lambda functions, the ‘Iterator Age’ is a crucial metric to monitor.
This measures the time difference between when a record arrives in the stream and when the Lambda function actually processes it. A high ‘Iterator Age’ can indicate that your function is struggling to keep pace with the incoming data stream.
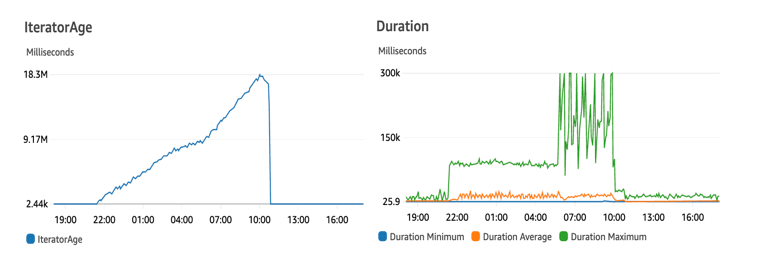
In the above image, we can see that the IteratorAge has been increasing.
This situation arises either when data is being added to a single shard at a pace that outpaces the consumer’s processing speed, or when the consumer is unable to complete its processing due to errors.
Why should you monitor the “Iterator Age” metric?
Monitoring the “IteratorAge” metric is crucial for maintaining the health and efficiency of production applications.
A high IteratorAge indicates that the Lambda function may be processing outdated data or not keeping pace with incoming data, which can lead to data loss and inaccurate real-time processing. By tracking this metric, you can identify potential issues early, optimize performance, and ensure the integrity of your data processing tasks.
Striking a Balance in AWS Lambda Metric Monitoring
We’ve explored several critical AWS Lambda metrics that should be regularly monitored. While numerous other metrics are available, remember that excessive alerts can create unnecessary noise and divert attention from significant issues. Therefore, it’s important to maintain a focused set of alerts that accurately reflect your Lambda functions’ health and performance.
Advantages of Using Third-Party Monitoring Tools for AWS Lambda
While AWS provides a robust set of metrics and tools for monitoring your Lambda functions, there are several reasons why you may still want to consider using third-party monitoring tools like Helios, Datadog, Dashbird
For example, Helios is a developer platform that provides meaningful insights into your end-to-end application flows by adapting OpenTelemetry’s context propagation framework to connect the dots.
The Helios platform provides end-to-end visibility across microservices, serverless functions, databases, and third-party APIs, enabling swift issue identification, reproduction, and resolution. Moreover, Helios presents distributed tracing information in full context. Essentially, It serves as a single source of truth, allowing for a comprehensive understanding of data flow across your application in any environment.
You can get started with Helios free tier to try its features in your distributed production workloads. In addition, you can experiment with the tool in its sandbox too.
Wrapping up
Effectively monitoring AWS Lambda functions is paramount for optimal performance, rapid troubleshooting, and cost management.
This guide elaborates on monitoring the three types of Lambda function invocations: synchronous, asynchronous, and Event Source Mapping. Key metrics include Function Error Rate, Function Duration, Concurrent Execution, Throttles, Dead-Letter Errors for asynchronous invocations, and IteratorAge for Event Source Mapping.
As serverless computing continues to evolve with AWS Lambda at the forefront, mastering these monitoring techniques will empower businesses to fully harness the benefits of serverless architectures, ensuring an efficient and cost-effective operation.
☕ Support My Work
If this article helped you, consider buying me a coffee to support more practical AWS content. 👉 [https://buymeacoffee.com/mjmrz�50�
🔗 Connect with Me
- LinkedIn: [http://www.linkedin.com/in/mjmrz�51�
- YouTube: [https://www.youtube.com/@EnlearAcademy�52�