I’ve been using Amazon CloudWatch as a centralized logging and observability tool for quite some time now. One of the realities teams quickly discovers when using CloudWatch at scale is cost.
As you may already know, CloudWatch charges for both log ingestion and storage, and these costs can add up rapidly in high-throughput systems if you are not careful about the way you ingest the logs and set retention time on the logs.
Because of this, I’ve seen a tendency in the industry to move away from CloudWatch Logs and redirecting logs to Amazon S3 and using tools like Athena for ad-hoc analysis instead.
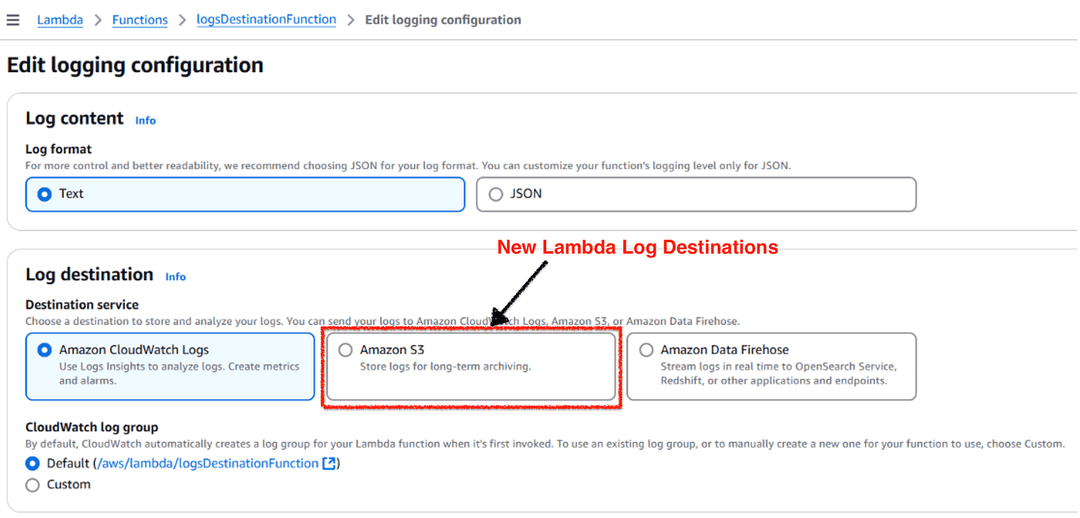
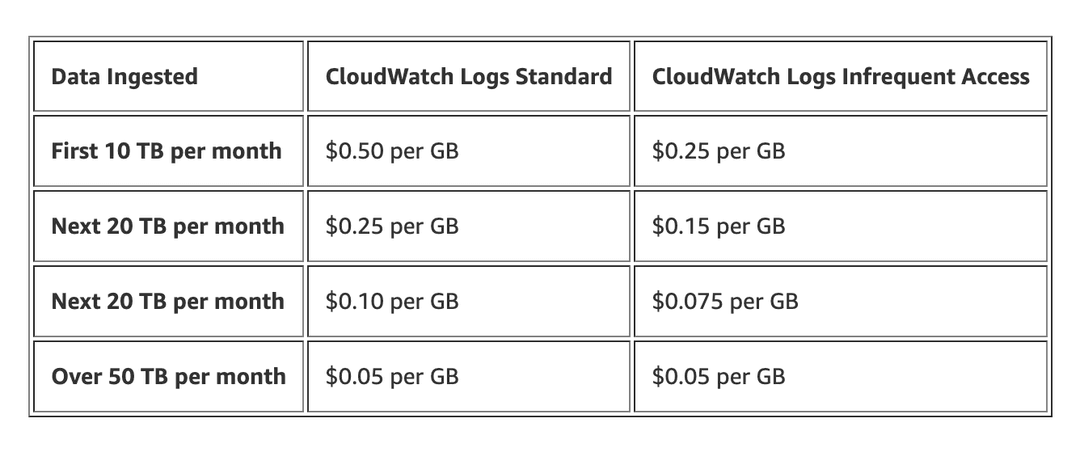
That said, AWS has been introducing several cost-optimization features for CloudWatch. Capabilities such as CloudWatch Logs Infrequent Access, Lambda log delivery optimizations, and tiered pricing for CloudWatch Logs can significantly reduce operational costs when used correctly.
CloudWatch Investigations
Beyond cost optimizations, what caught my attention in the re:Invent 2025 were the GenAI-powered features released by the CloudWatch team. Particularly the CloudWatch Investigations.
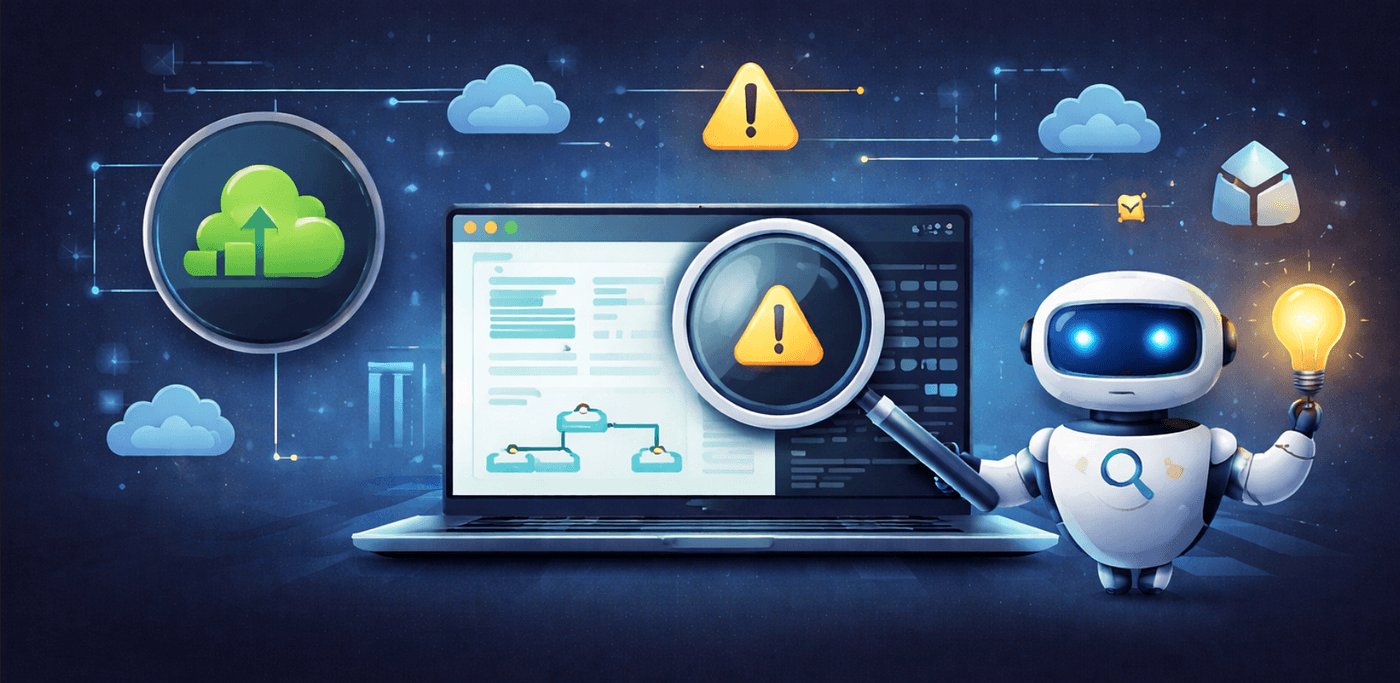
CloudWatch Investigations uses GenAI to analyze your system’s telemetry data including metrics, logs, and traces and quickly surfaces relevant signals, correlations, and suggestions that may be related to an ongoing issue.
After spending some hands-on time with this feature, I felt it was worth sharing my experience and learnings in this blog post.
What is CloudWatch Investigations?
When I first heard about CloudWatch Investigations, I assumed it was yet another tool focused on investigating security vulnerabilities, something similar to Amazon GuardDuty, powered by services like CloudTrail and AWS Config.
Little did I know that it is actually a comprehensive, GenAI-powered assistant designed to reduce the time spent troubleshooting application and infrastructure issues (MTTR)
Instead of manually hopping between dashboards, log groups, and traces, the investigation brings the most relevant context together in one place.
My Current Observability Strategy
Observability is the ability to understand whether your internal application components are behaving as expected by analyzing external signals emitted by the system.
These signals are commonly referred to as the three pillars of observability:
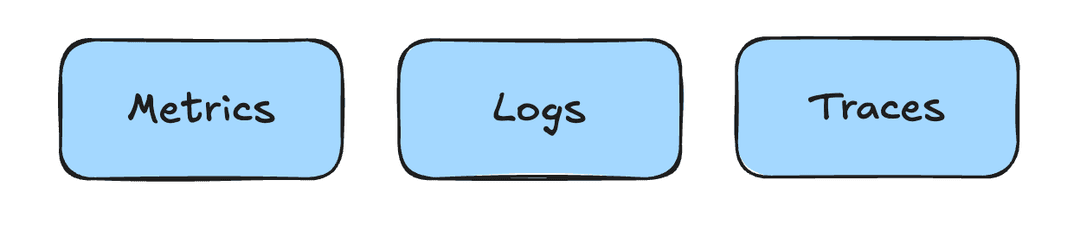
When building applications, we emit these signals from our application components and then set up monitoring and alerting workflows around them.
Metrics, Logs and Traces allows us to detect anomalies, understand system behavior, and troubleshoot issues when things go wrong.
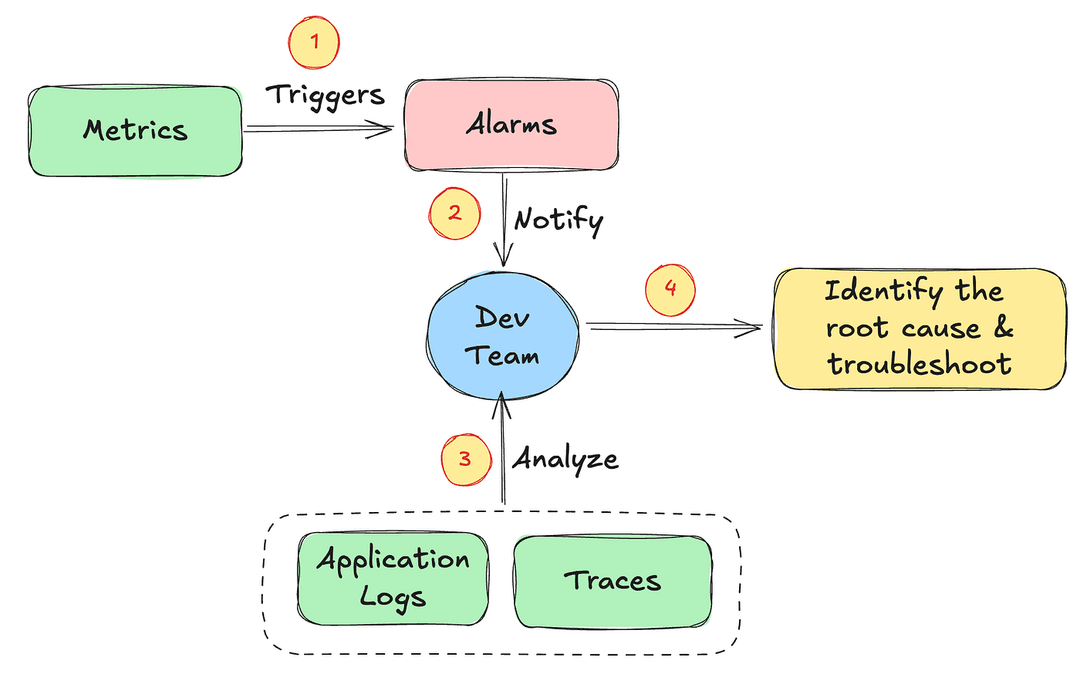
In a typical monitoring flow, we receive alarms when carefully selected metrics such as CPU utilization exceeding 70% or Lambda errors > 0 cross their defined thresholds.
Once an alarm is triggered, the next step is to investigate logs and traces to identify the root cause and begin troubleshooting.
I usually configure (via Amazon Q Developer for Chat Application) a communication channel such as Microsoft Teams or Slack to receive these alarms, along with metric snapshots and data points.
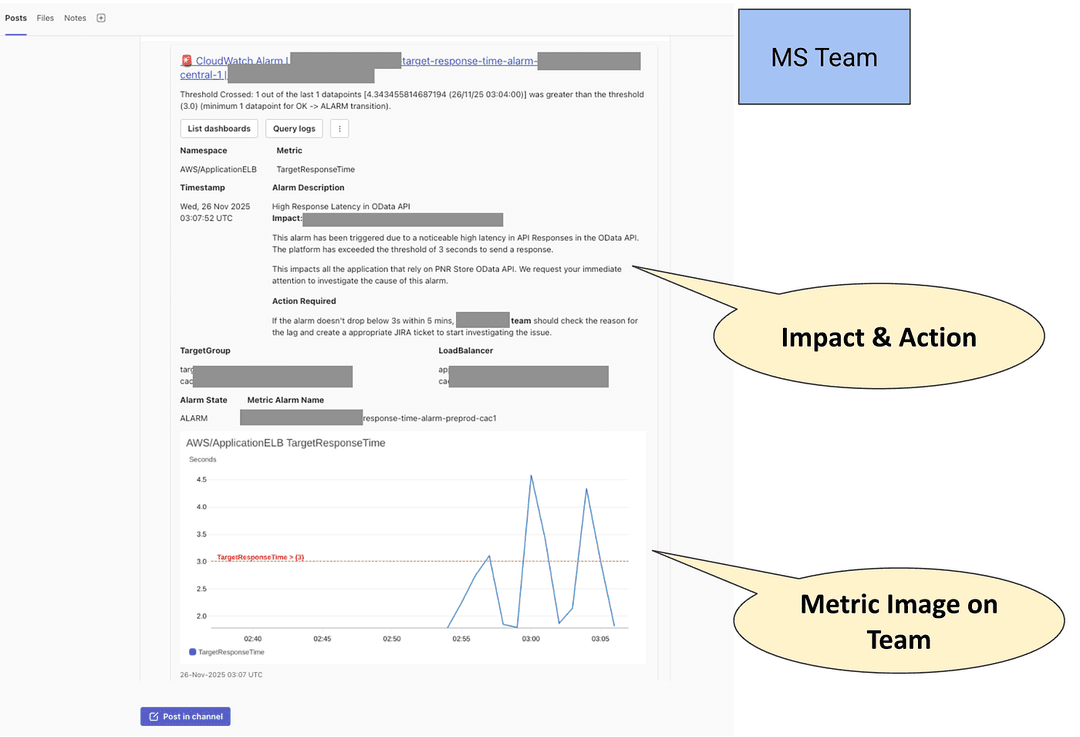
From there, I move to an observability dashboard such as a CloudWatch Dashboard to analyze the behavior of other related matrices across other components (E.g. Database, MSK Cluster, Consumer Offset Lags etc…) over time. This helps narrow down the specific application components that may be contributing to the issue.
Finally, I dive deeper into application logs and traces for those components to identify the root cause and start resolving the problem.
How does CloudWatch Investigations help in this process?
CloudWatch Investigations uses GenAI to help identify root causes and troubleshoot issues.
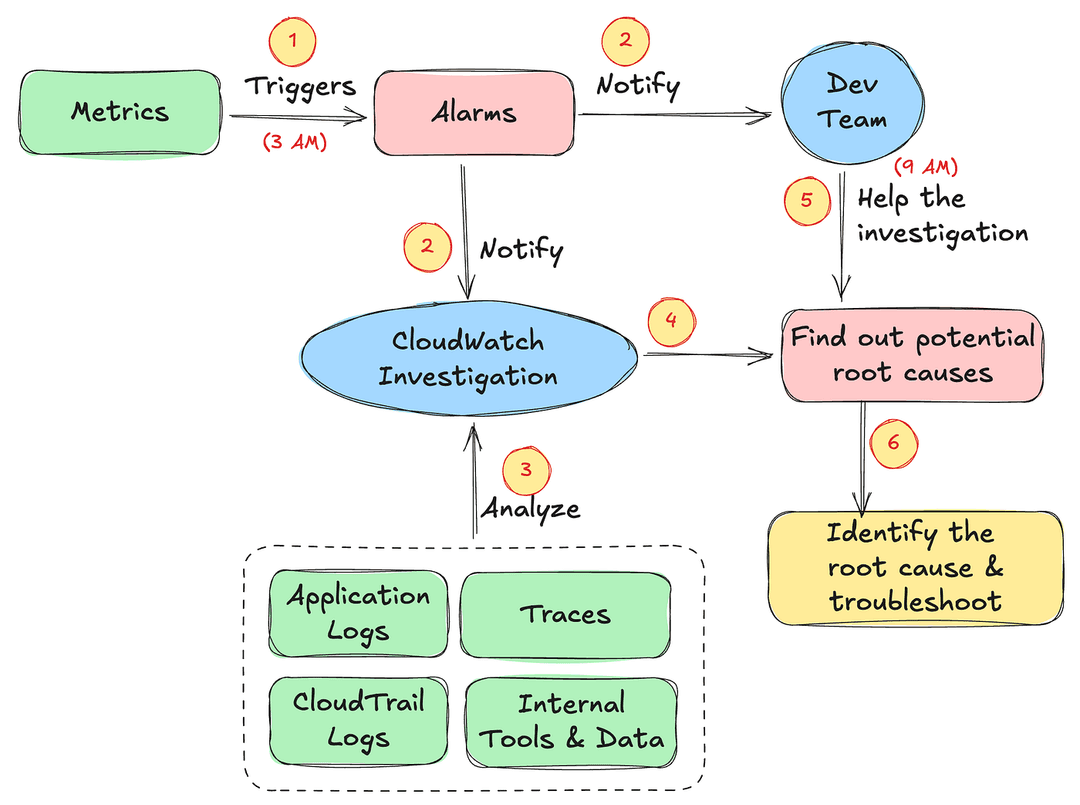
Instead of waking up to an early morning alarm and starting troubleshooting from zero, CloudWatch Investigations performs the initial analysis for you by identifying the application topology and analyzing application logs, CloudTrail logs, X-Ray traces, and internal data to surface potential root causes.
Yes — it can even identify your application’s architecture topology, which is really powerful.
So the dev team starts the day with context and a clear direction to fix the issue along with CloudWatch Investigation.
Let’s See that in Action — An Example⚡
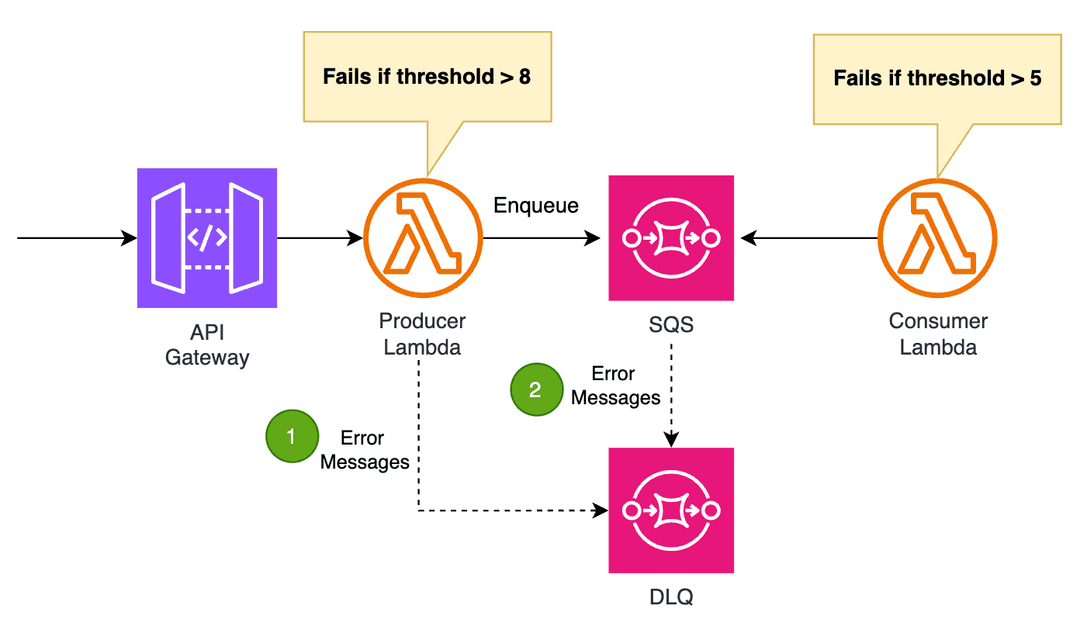
The above example event-driven architecture (EDA) accepts requests through Amazon API Gateway. The Lambda function(Producer Lambda) behind the API Gateway evaluates the incoming message and pushes it to an SQS queue if the message threshold is less than 8. Otherwise, the message is sent directly to the DLQ (1).
Next, we have an SQS consumer Lambda that processes messages from the queue asynchronously. If an error occurs during processing, the consumer Lambda throws an error and the message is returned to the SQS queue for retry.
When SQS receives the failure message from the consumer lambda and it exceeds the maximum retry attempts configured at the SQS (In this example we set the retry attempts to 1), it is automatically moved to the DLQ(2) and is not reprocessed.
CloudWatch Alarm for Failed Messages
We configure a CloudWatch alarm to trigger when there are messages in the DLQ. The CloudWatch metric used for this is **ApproximateNumberOfMessagesVisible**
If ApproximateNumberOfMessagesVisible is greater than zero, a CloudWatch alarm is triggered and a notification is sent to the configured SNS topic.
This SNS topic then delivers the message to MS Teams or Slack via Amazon Q Developer for Chat Applications (see Action 01 in the figure below).
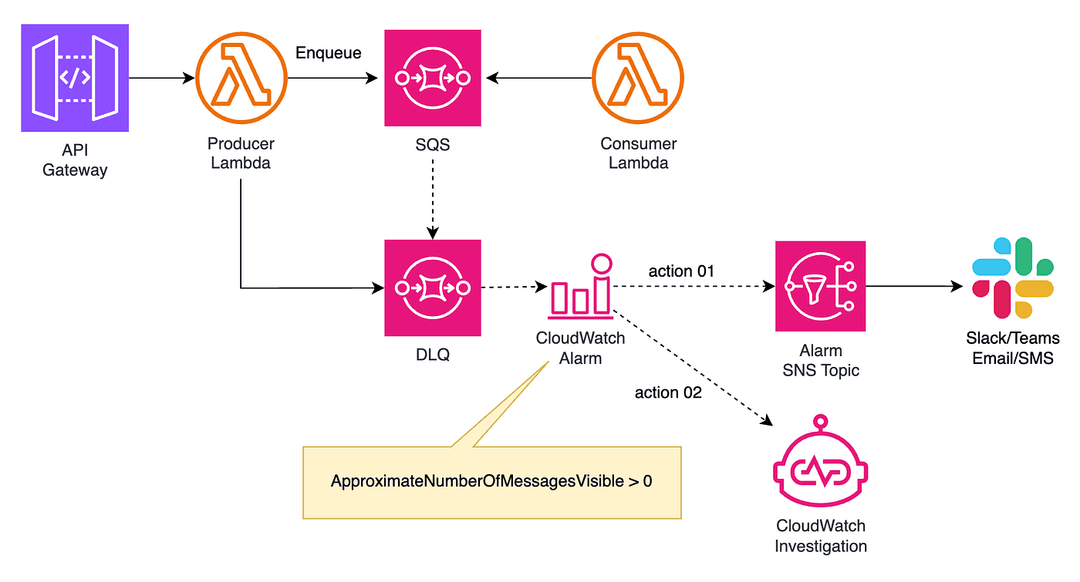
We can also configure another CloudWatch action (Action 02) to initiate a CloudWatch Investigation when the alarm is triggered.
This allows us to automatically start a CloudWatch Investigation when ApproximateNumberOfMessagesVisible metrics is greater than Zero.
CDK IaC Code
I used AWS CDK to provision the infrastructure and to test the results of the CloudWatch Investigation.
export class CloudwatchInvestigationDemoStack extends cdk.Stack {
  constructor(scope: Construct, id: string, props?: cdk.StackProps) {
    super(scope, id, props);

    // Dead Letter Queue
    const dlq = new sqs.Queue(this, 'DLQ', {
      queueName: 'cloudwatch-investigation-dlq',
      retentionPeriod: cdk.Duration.days(14)
    });

    // Main SQS Queue with DLQ
    const queue = new sqs.Queue(this, 'MainQueue', {
      queueName: 'cloudwatch-investigation-queue',
      visibilityTimeout: cdk.Duration.seconds(30),
      deadLetterQueue: {
        queue: dlq,
        maxReceiveCount: 1 // Send to DLQ after 1 failed attempt
      }
    });

    // Producer Lambda Function
    const producerFunction = new NodejsFunction(this, 'ProducerFunction', {
      functionName: 'cloudwatch-investigation-producer',
      runtime: lambda.Runtime.NODEJS_20_X,
      handler: 'handler',
      entry: 'lambda/producer.ts',
      timeout: cdk.Duration.seconds(10),
      environment: {
        QUEUE_URL: queue.queueUrl,
        DLQ_URL: dlq.queueUrl
      },
      logRetention: logs.RetentionDays.ONE_WEEK,
      tracing: lambda.Tracing.ACTIVE // Enable X-Ray tracing
    });

    // Grant producer permission to send messages to queue and DLQ
    queue.grantSendMessages(producerFunction);
    dlq.grantSendMessages(producerFunction);

    // Consumer Lambda Function
    const consumerFunction = new NodejsFunction(this, 'ConsumerFunction', {
      functionName: 'cloudwatch-investigation-consumer',
      runtime: lambda.Runtime.NODEJS_20_X,
      handler: 'handler',
      entry: 'lambda/consumer.ts',
      timeout: cdk.Duration.seconds(10),
      logRetention: logs.RetentionDays.ONE_WEEK,
      tracing: lambda.Tracing.ACTIVE // Enable X-Ray tracing
    });

    // Add SQS as event source for consumer
    consumerFunction.addEventSource(new lambdaEventSources.SqsEventSource(queue, {
      batchSize: 1
    }));

    // API Gateway
    const api = new apigateway.RestApi(this, 'InvestigationDemoApi', {
      restApiName: 'CloudWatch Investigation Demo API',
      description: 'API for CloudWatch Investigation Demo',
      deployOptions: {
        stageName: 'prod',
        loggingLevel: apigateway.MethodLoggingLevel.INFO,
        dataTraceEnabled: true,
        tracingEnabled: true // Enable X-Ray tracing for API Gateway
      }
    });

    // API Gateway integration with Producer Lambda
    const producerIntegration = new apigateway.LambdaIntegration(producerFunction);
    api.root.addMethod('POST', producerIntegration);

    // SNS Topic for Alarms
    const alarmTopic = new sns.Topic(this, 'AlarmTopic', {
      topicName: 'cloudwatch-investigation-alarms',
      displayName: 'CloudWatch Investigation Alarms'
    });

    // CloudWatch Alarm on DLQ Messages
    const dlqAlarm = new cloudwatch.Alarm(this, 'DemoDLQAlarm', {
      alarmName: 'cloudwatch-investigation-dlq-messages',
      alarmDescription: 'Alarm when messages are visible in DLQ',
      metric: dlq.metricApproximateNumberOfMessagesVisible({
        period: cdk.Duration.minutes(1),
        statistic: 'Average'
      }),
      threshold: 0,
      evaluationPeriods: 1,
      comparisonOperator: cloudwatch.ComparisonOperator.GREATER_THAN_THRESHOLD,
      treatMissingData: cloudwatch.TreatMissingData.NOT_BREACHING
    });

    // Add SNS action to alarm
    dlqAlarm.addAlarmAction(new cloudwatch_actions.SnsAction(alarmTopic));
  }
}
You can also provision CloudWatch Investigation Group using CloudFormation (via a CDK L1 construct). However, in this example, I created it manually in the AWS Management Console, and you’ll see the screenshots toward the end of this blog post.
Producer Lambda
This is the producer Lambda function behind the API Gateway. It generates messages with random threshold values and fails the messages when the threshold is greater than 8. otherwise, the messages are sent to the SQS queue.
import { APIGatewayProxyEvent, APIGatewayProxyResult } from 'aws-lambda';
import { SQSClient, SendMessageCommand } from '@aws-sdk/client-sqs';

const sqsClient = new SQSClient({});
const QUEUE_URL = process.env.QUEUE_URL!;
const DLQ_URL = process.env.DLQ_URL!;

export const handler = async (event: APIGatewayProxyEvent): Promise<APIGatewayProxyResult> => {
  try {
    // Generate random threshold between 1-10
    const threshold = Math.floor(Math.random() * 10) + 1;
    const messageId = `msg-${Date.now()}-${Math.random().toString(36).substring(7)}`;

    const payload = {
      messageId,
      threshold,
      timestamp: new Date().toISOString(),
      source: 'producer'
    };

    console.log('Processing message:', JSON.stringify(payload));

    // Producer fails if threshold > 8
    if (threshold > 8) {
      console.error(`Producer validation failed: Threshold ${threshold} exceeds producer limit of 8`);

      // Send failed message directly to DLQ
      await sqsClient.send(new SendMessageCommand({
        QueueUrl: DLQ_URL,
        MessageBody: JSON.stringify({
          ...payload,
          failureReason: 'Producer validation failed',
          failureStage: 'producer',
          errorMessage: `Threshold ${threshold} exceeds producer limit of 8`
        })
      }));

      console.log(`Message sent to DLQ: ${messageId}`);

      return {
        statusCode: 500,
        body: JSON.stringify({
          message: 'Producer validation failed',
          payload,
          error: `Threshold ${threshold} exceeds producer limit of 8`
        })
      };
    }

    // Send to main queue if threshold <= 8
    console.log('Sending message to main queue:', JSON.stringify(payload));

    await sqsClient.send(new SendMessageCommand({
      QueueUrl: QUEUE_URL,
      MessageBody: JSON.stringify(payload)
    }));

    return {
      statusCode: 200,
      body: JSON.stringify({
        message: 'Message sent successfully',
        payload
      })
    };
  } catch (error) {
    console.error('Error processing message:', error);
    return {
      statusCode: 500,
      body: JSON.stringify({
        message: 'Failed to process message',
        error: error instanceof Error ? error.message : 'Unknown error'
      })
    };
  }
};
Consumer Lambda
The consumer Lambda function processes messages from the SQS queue and fails the messages when the threshold is greater than 5.
import { SQSEvent, SQSRecord } from 'aws-lambda';

interface MessagePayload {
  messageId: string;
  threshold: number;
  timestamp: string;
}

export const handler = async (event: SQSEvent): Promise<void> => {
  for (const record of event.Records) {
    await processMessage(record);
  }
};

async function processMessage(record: SQSRecord): Promise<void> {
  try {
    const payload: MessagePayload = JSON.parse(record.body);

    console.log('Processing message:', JSON.stringify(payload));

    // Intentionally throw error if threshold > 5
    if (payload.threshold > 5) {
      console.error(`Consumer validation failed: Threshold ${payload.threshold} exceeds consumer limit of 5`);
      throw new Error(`Threshold ${payload.threshold} exceeds consumer limit of 5`);
    }

    console.log(`Message processed successfully: ${payload.messageId}`);
  } catch (error) {
    console.error('Error processing message:', error);
    throw error; // Re-throw to trigger SQS retry mechanism
  }
}
After the infrastructure is deployed, I plan to send multiple requests to the API Gateway. This generates messages with random threshold values, some of which end up in the DLQ from both the Producer and Consumer Lambda functions.
As a result, the ApproximateNumberOfMessagesVisible metric for the DLQ becomes greater than zero, which triggers the CloudWatch alarm and initiates a CloudWatch Investigation.
Creating the CloudWatch Investigation
Before creating a CloudWatch Investigation, we need to configure it. This includes setting the retention period for investigation data (7–90 days) and configuring the required IAM permissions for the investigation.
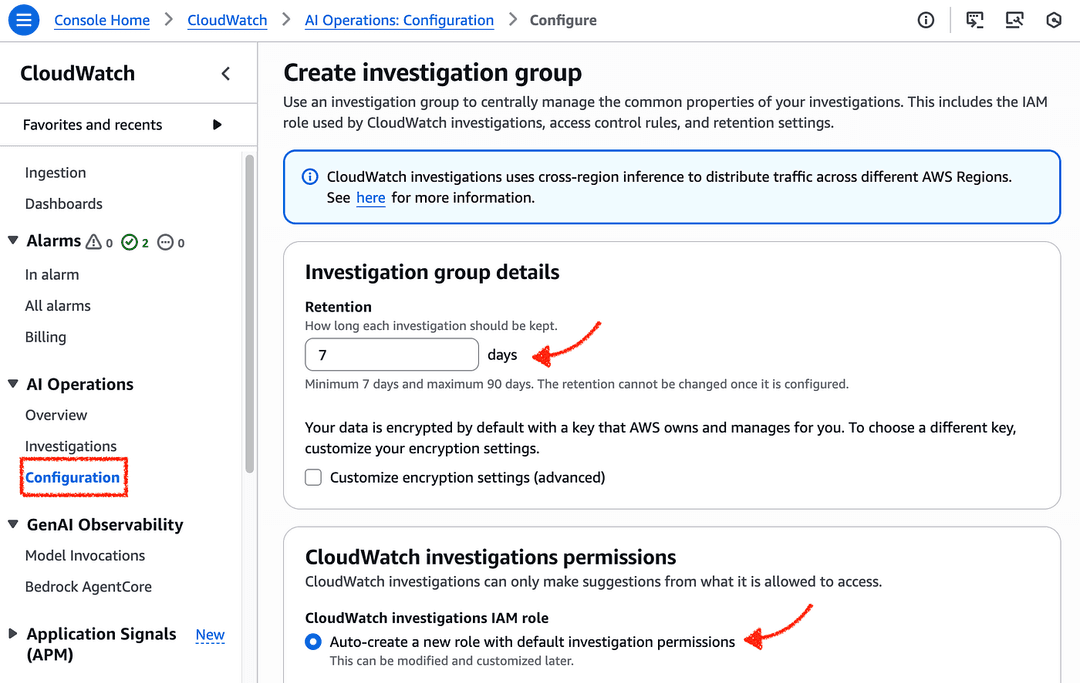
Triggering an Investigation from the DLQ Alarm
You can trigger a CloudWatch Investigation either manually or automatically using a CloudWatch alarm.
In practice, it’s much better to trigger the investigation when the alarm fires, so you don’t have to wake up at 3 AM and start troubleshooting from scratch while an issue is already happening.
Therefore I edited the cloudwatch-investigation-dlq-messages alarm that I deployed with CDK and added an action to trigger a CloudWatch Investigation.
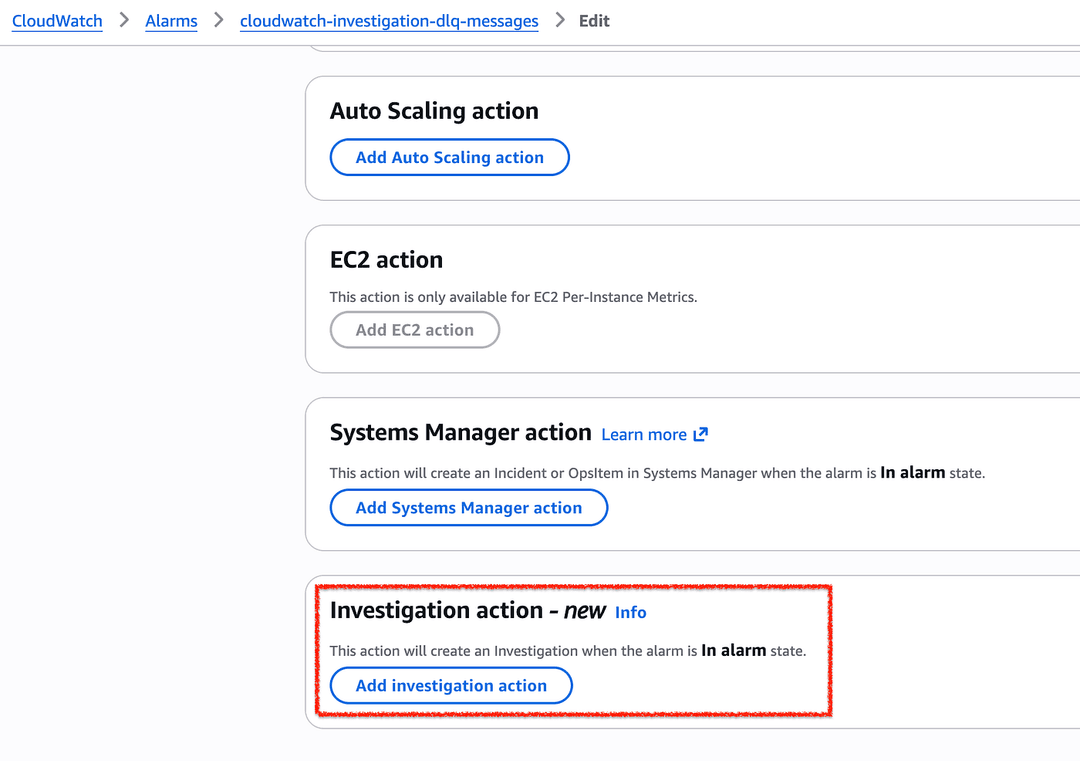
Testing the Investigation
Now it’s time to test the setup. I sent several API requests to generate random errors, and I can see that some messages have ended up in the DLQ.
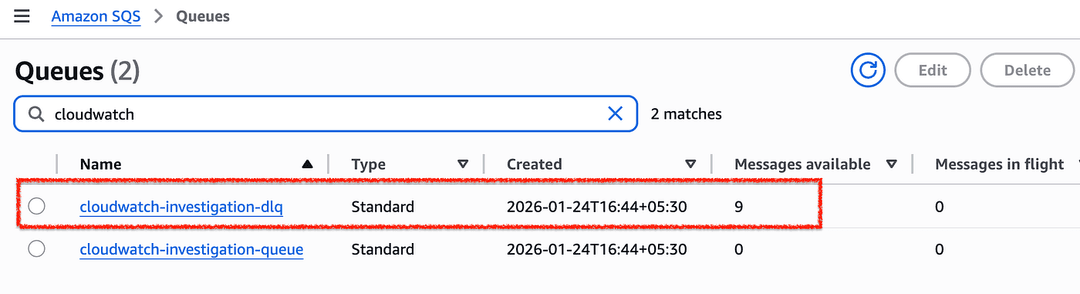
This should put the DLQ alarm into the In Alarm state and trigger the investigation.
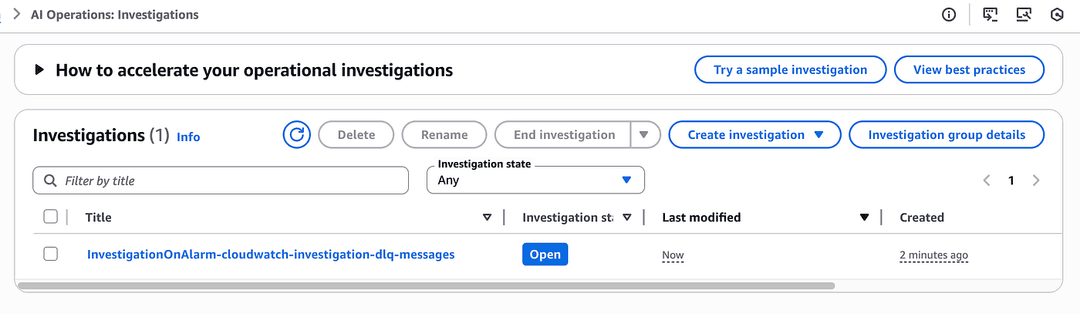
As expected, I can see that the investigation has been triggered successfully. It even derived my component architecture as part of the investigation.
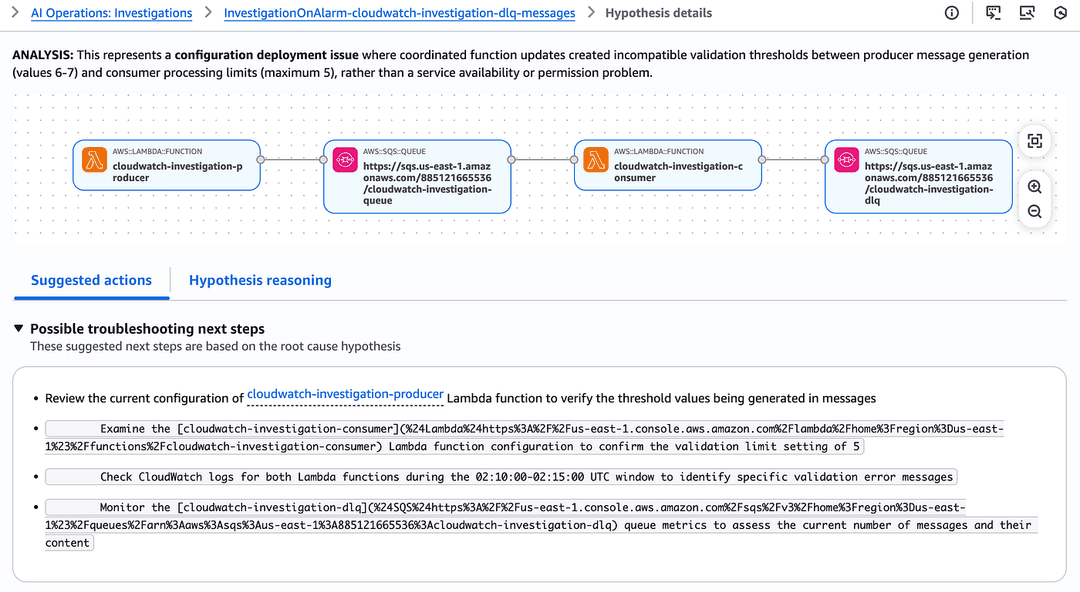
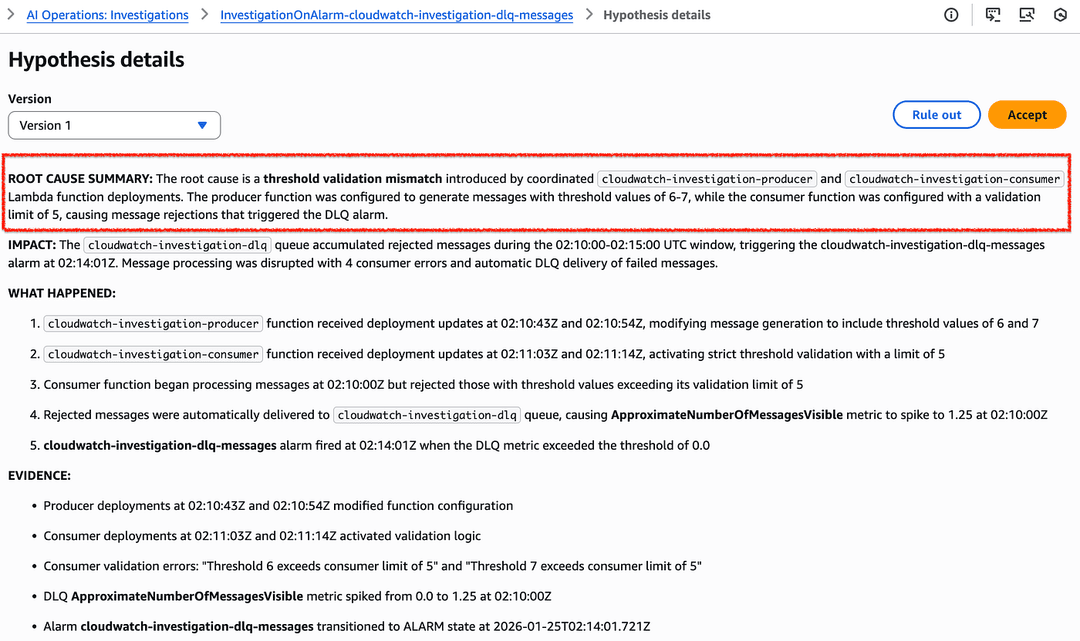
Finally, the investigation produced a root-cause hypothesis, and it’s spot on.
The Suggested Actions clearly indicate what I should do next to fix the issue.
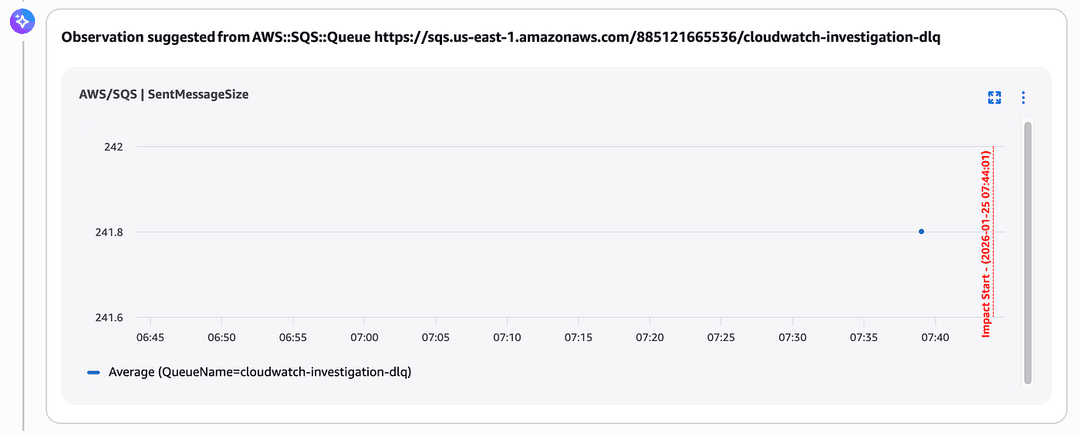
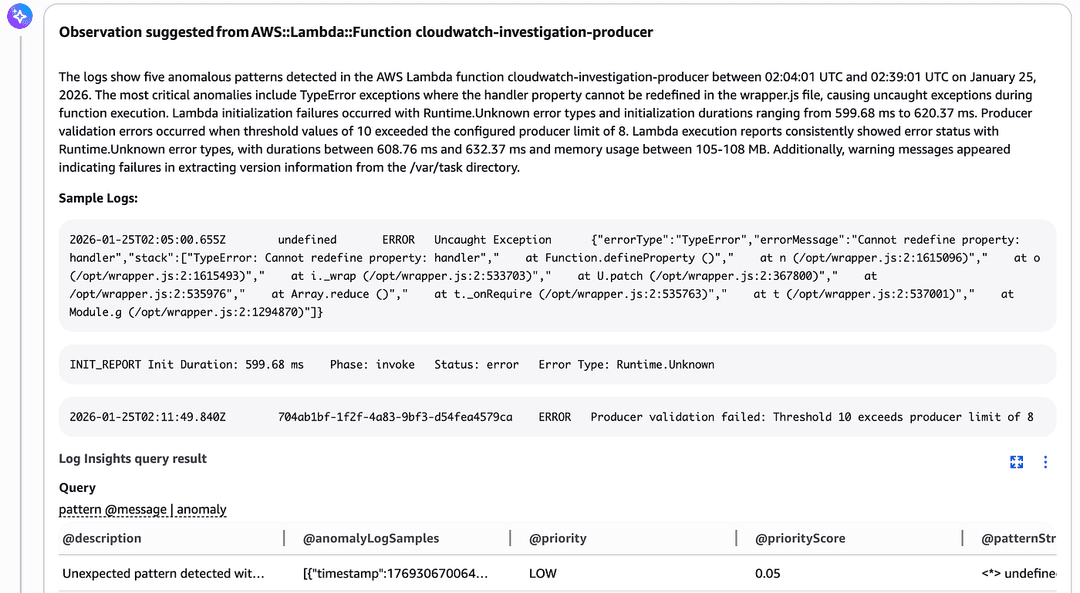
It also provides the hypothesis reasoning, showing how the investigation arrived at the hypothesis by:
- CloudTrail Logs

2. CloudWatch Metrics
- CloudWatch Logs and Logs Insights queries (it even ran anomaly detection queries as well).
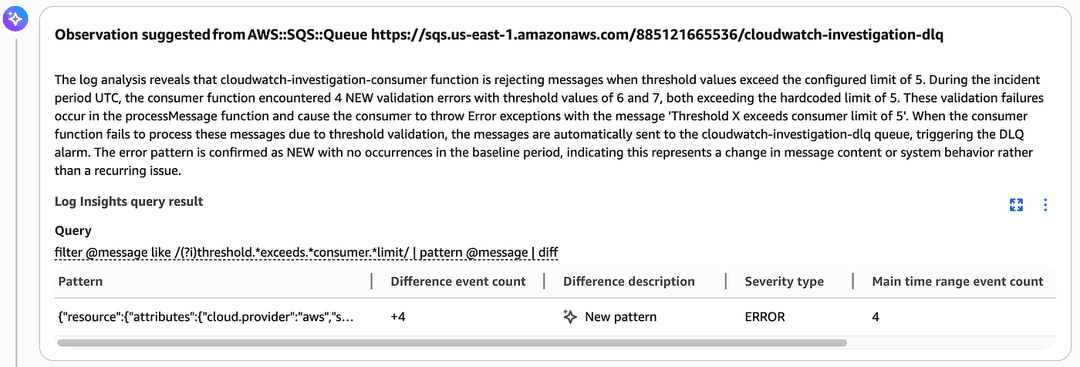
How can we support CloudWatch Investigations?
We can support an investigation by adding our own analysis and observations as notes.
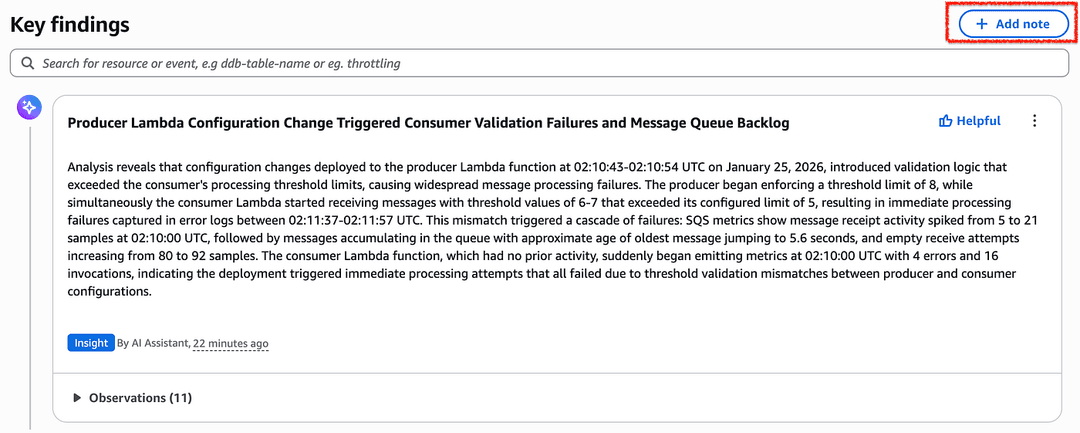
Then, the ongoing investigations will take these notes into consideration as well. After all, since it uses GenAI, it can produce more accurate results when more relevant context is available.
Also, in the CloudWatch Investigations best practices guide, AWS recommends enabling the following options:
- Enable CloudTrail logs (already enabled in this example)
- Enable AWS X-Ray (see the CDK code in Figure 10 for how X-Ray tracing is enabled for API Gateway and Lambda)
- Enable Application Signals (not enabled in this example)
Incident Report
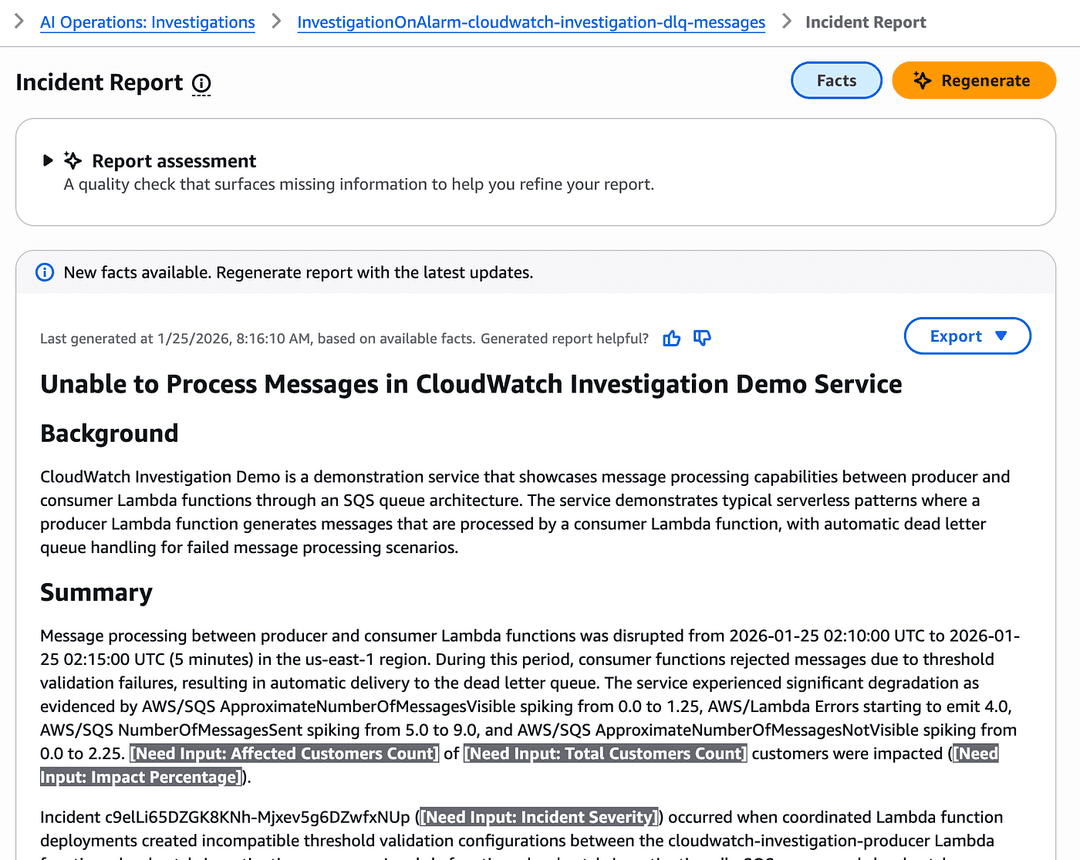
After the investigation, I can also generate an incident report using the 5 Whys framework, which AWS also practices internally.
Further Reading
If you want to explore CloudWatch Investigations in more detail, the following resources are worth checking out:
Conclusion
After spending some hands-on time with CloudWatch Investigations, it honestly feels like a big step forward in how we handle incidents on AWS.
What impressed me most is how well the GenAI layer ties everything together. It doesn’t just surface raw data, it connects the dots, understands the application topology, and even explains its own reasoning.
When you combine that with good alarms, traces, and logs, you end up spending far less time figuring out what’s wrong and more time actually fixing it.
☕ Support My Work
If this article helped you, consider buying me a coffee to support more practical AWS content. 👉 [https://buymeacoffee.com/mjmrz�160�
🔗 Connect with Me
- LinkedIn: [http://www.linkedin.com/in/mjmrz�161�
- YouTube: [https://www.youtube.com/@EnlearAcademy�162�
- YouTube (Sinhala): [https://www.youtube.com/@manojbfernando�163�